Data Handling for Class 3

Table of Content

  • What is Data Handling?
  • Types of Graphs and Charts
  • What is Pictograph?
  • What is Bar Graph?
  • What is Pie Chart?
  • In our daily lives, being able to handle data is an essential skill. It helps us collect, organize and make sense of information. In this article, we will explore the basics of data handling and how it plays a crucial role in our daily routines.

    What is Data Handling?

    Data handling is the procedure of gathering, arranging and presenting data in different ways. Data itself is composed of numerical numbers or information that denotes particular facts. Data handling is important for research data. Proper planning for data handling can also result in efficient and economical storage.

    In data handling, we use pictures, bars or graphs to represent numbers and information. These pictures, bars or graphs are the visual representations that make it easier for us to understand and acquire the information.

    Types of Graphs and Charts

    There are three main types of graphs and charts:

    → Pictograph

    → Bar Graph

    → Pie Chart

    What is Pictograph?

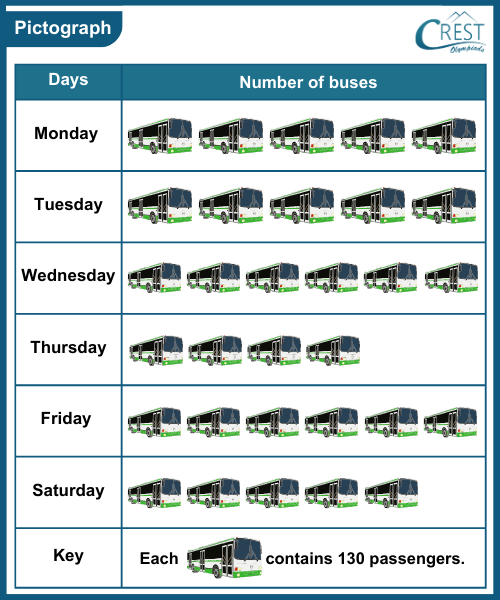
    A pictograph is a visual representation of data that uses pictures or symbols. It is a visual way to convey information where the size or number of pictures corresponds to the quantity being represented.

    Example: The pictograph given below expresses the number of buses that run from Dubai to Abu Dhabi on each day of the week.

    cmo-data-c3-1

    How many passengers can travel on Wednesday?

    a) 720
    b) 760
    c) 780
    d) 860

    Answer: c) 780

    Explanation: Number of buses that run on Wednesday = 6
    Number of passengers travel in 1 bus = 120
    Total number of passengers travel in 6 buses = 6 × 130 
                                                                      = 780

    What is Bar Graph?

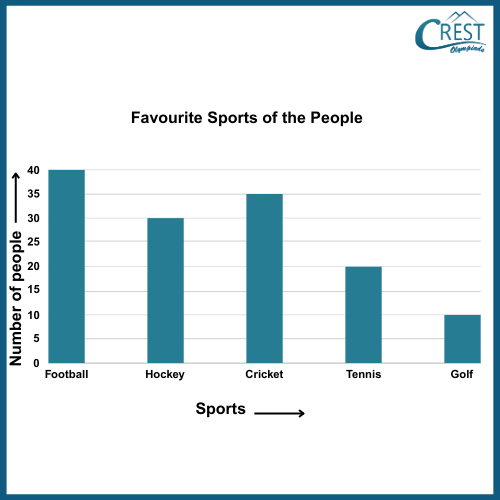
    A bar graph is a visual representation of data representation of data presented in the form of bars of different lengths or heights. A bar graph is also known as a column graph or bar chart. Each bar length is equal to the amount of data it represents, making it simple to compare values.

    Example: Carefully observe the bar graph which represents the number of people who like different sports and answer the following questions.

    cmo-data-c3-2

    What is the difference in the number of people who like hockey and golf?

    a 10
    b) 20
    c) 30
    d) 40

    Answer: b) 20

    Explanation: Number of people who like hockey = 30
    Number of people who like golf = 10
    Difference in the number of people who like hockey and golf = 30 − 10 = 20

    What is Pie Chart?

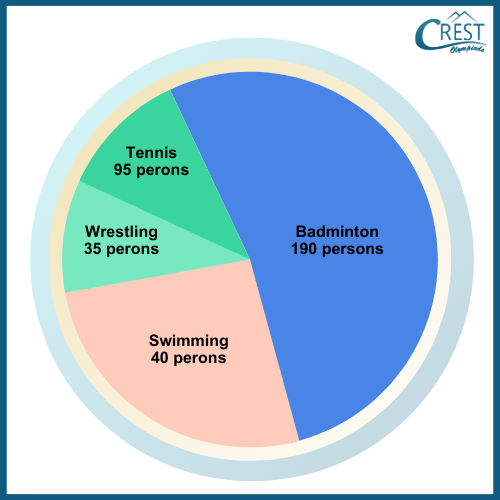
    A pie chart is a circular graph divided into sectors to represent data. Each sector represents a portion of the whole. The size of each segment indicates how much of that part of the pie chart is there compared to the whole.

    Example: The pie chart gives the details of the number of people who like sports. Carefully observe the pie chart and answer the following question.

    cmo-data-c3-3

    What is the total number of people who dislike these sports if there are 1,000 people?

    a) 360
    b) 640
    c) 720
    d) 960

    Answer: b) 640

    Explanation: Total number of people = 1000

    Total number of people who dislike these sports = 190 + 95 + 35 + 40
                                                                          = 360

    Total number of people who dislike these sports = 1000 − 360 
                                                                          = 640

    These types of graphs and charts are valuable tools for presenting data visually and making complex information more accessible and understandable.

    Quick Video Recap

    In this section, you will find interesting and well-explained topic-wise video summary of the topic, perfect for quick revision before your Olympiad exams.

    ***COMING SOON***

    ×

    Share Your Feedback

    CREST Olympiads has launched this initiative to provide free reading and practice material. In order to make this content more useful, we solicit your feedback.

    Do share improvements at info@crestolympiads.com. Please mention the URL of the page and topic name with improvements needed. You may include screenshots, URLs of other sites, etc. which can help our Subject Experts to understand your suggestions easily.

    Maths Related Topics for Class 3

    Other Subjects for Class 3

    70%