Pictographs for Class 1

Table of Content

  • Pictograph
  • How to make a Pictograph?
  • Pictograph

    A pictograph is a type of graphical representation in which symbols or pictures are used to represent data or information. These symbols or pictures can be used to represent numbers, quantities, or data sets in a way that is easy to understand and interpret. Pictographs are often used in charts, graphs, and other types of data visualisation tools to make complex data more accessible to a wide audience.

    For example, let's look at an example that explains how pictographs can be used to comprehend data.

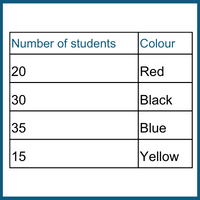
    In the given table, the information of 100 students has been gathered, who like various colours.

    pictograph-1

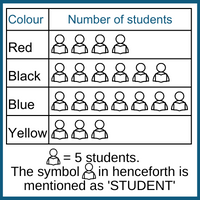
    The information above can be expressed as a pictograph as follows:

    pictograph-2

    As you can see, the given data becomes more visually appealing and easier to interpret.

    What is the difference between students who like the colours blue and red?

    Solution: Students who like the colour blue = 7 symbols
    Students who like the colour red = 4 symbols
    Therefore difference = 7 - 4 = 3 symbols
    Each symbol represents 5 students.

    Therefore, the difference is equal to 15 students.

    How to make a Pictograph?

    1. Choose a topic: Decide on a topic that you want to make a pictograph about. This could be anything from the number of different types of animals in a zoo to the number of students in a class who like different types of music.

    2. Collect data: Gather data on the topic you have chosen. This could be done by conducting a survey, counting items, or researching online.

    3. Organise the data: Organise the data into categories or groups. For example, if you are making a pictograph about the number of different types of animals in a zoo, you could organise the data into categories such as mammals, birds, reptiles, and fish.

    4. Create a key: Create a key for the pictograph. This should include a list of the categories or groups you have used and a symbol or image that represents each one. All the symbols/images used must be of the same size.

    5. Draw the pictograph: Draw a grid with a horizontal and a vertical axis. On the horizontal axis, write the categories or groups and on the vertical axis, write the numbers or data. Using the key, place the symbols or images on the grid to represent the data.

    6. Label the pictograph: Add a title and label to the pictograph to make it clear what the data represents and what the categories or groups are.

    7. Review and finalise: Review the pictograph to make sure it is clear and easy to understand. Make any necessary adjustments before finalizing it.

    Note: All the symbols/objects must be of the same size. We can also use a fraction of a symbol/object to show data.

    Quick Video Recap

    In this section, you will find interesting and well-explained topic-wise video summary of the topic, perfect for quick revision before your Olympiad exams.

    ***COMING SOON***

    ×

    Share Your Feedback

    CREST Olympiads has launched this initiative to provide free reading and practice material. In order to make this content more useful, we solicit your feedback.

    Do share improvements at info@crestolympiads.com. Please mention the URL of the page and topic name with improvements needed. You may include screenshots, URLs of other sites, etc. which can help our Subject Experts to understand your suggestions easily.

    Mental Maths Related Topics

    Other Subjects for Class 1

    70%