Solved Questions Based on Statistics
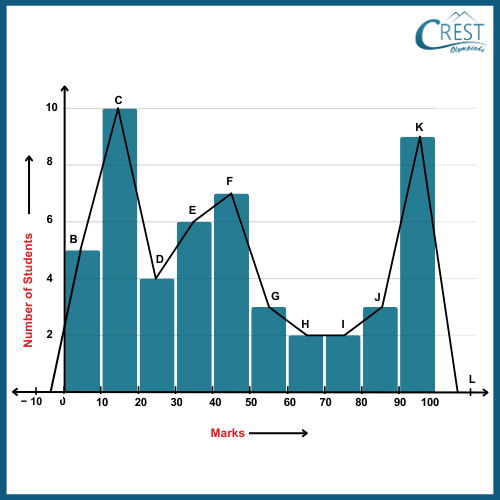
1. Consider the given frequency polygon representing the marks obtained by students of a class in a test.

What percentage of students scored more than 40 but less than 90?
a) 33.75%
b) 33.67%
c) 33.5%
d) 33.33%
Answer: d) 33.33%
Explanation: We are given the following frequency polygon
A frequency polygon is a graph that represents the frequency distribution of a dataset.
From the frequency polygon, we get the following frequency distribution table:
|
Marks
|
Number of Students
|
|
0 - 10
|
5
|
|
10 - 20
|
10
|
|
20 - 30
|
4
|
|
30 - 40
|
6
|
|
40 - 50
|
7
|
|
50 - 60
|
3
|
|
60 - 70
|
2
|
|
70 - 80
|
2
|
|
80 - 90
|
3
|
|
90 - 100
|
9
|
Total number of students = 5 + 10 + 4 + 6 + 7 + 3 + 2 + 2 + 3 + 9
= 51
No. of students scoring marks more than 40 but less than 90 = 7 + 3 + 2 + 2 + 3
= 17
Percentage of students scoring marks more than 40 but less than 90 = [(No. of students scoring marks more than 40 but less than 90) / (Total no. of students)] × 100
= (17 / 51) × 100
= 100 / 3
= 33.33%
2. Consider the given ogive or cumulative frequency curve representing the daily income of 50 workers of a factory.

What is the percentage of workers earning less than $140?
a) 52%
b) 55%
c) 50%
d) 51%
Answer: c) 50%
Explanation: We are given the following ogive
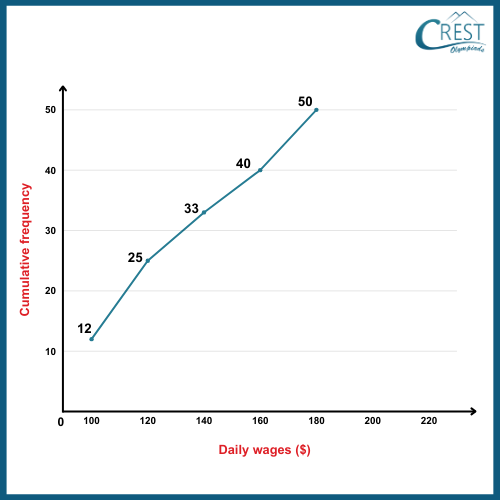
An ogive is a graphical representation that displays the cumulative frequencies of a dataset.
From the ogive, we get the following frequency distribution table:
|
Daily Income (in $)
|
Cumulative Frequency
|
|
Less than 120
|
12
|
|
Less than 140
|
25
|
|
Less than 160
|
33
|
|
Less than 180
|
40
|
|
Less than 200
|
50
|
|
Daily Income (in $)
|
Number of Workers
|
|
100 - 120
|
12
|
|
120 - 140
|
13
|
|
140 - 160
|
8
|
|
160 - 180
|
7
|
|
180 - 200
|
10
|
Total number of workers = 50
No. of workers earning less than $140 = 25
Percentage of workers earning less than $140 = [(No. of workers earning less than $140) / (Total no. of workers)] × 100
= (25 / 50) × 100
= 100/2
= 50%
3. Consider the given data:
|
x
|
5
|
10
|
15
|
20
|
25
|
30
|
35
|
|
f(frequency)
|
11
|
20
|
14
|
10
|
8
|
15
|
7
|
What is the mean of the given data using the direct method?
a) 18.357
b) 18.353
c) 18.358
d) 18.355
Answer: b) 18.353
Explanation: Steps for finding the mean using the direct method are:
a. Make a frequency table using the following three columns:
(i) Enter the variate (xi) values in the first column from the left.
(ii) Write the matching frequency (fi) for each variate in column (a) in the second column from the left.
(iii) Enter each value of fixi, or the product of each x and its frequency (f), in the third column.
b. To obtain ∑fi (the total of all the frequencies), add each entry in the second column.
c. To obtain ∑fixi, add each entry in the third column.
d. Required mean = ΣfixiΣfi
Thus,
>
|
xi
|
fi (frequency)
|
fixi
|
|
5
|
11
|
55
|
|
10
|
20
|
200
|
|
15
|
14
|
210
|
|
20
|
10
|
200
|
|
25
|
8
|
200
|
|
30
|
15
|
450
|
|
35
|
7
|
245
|
|
Σfi = 85
|
Σfixi = 1560
|
Now,
Mean = Σfixi⁄Σfi
= 1560 / 85
= 312 / 17
= 18.353
4. The weights of 35 students in a class are given below.
|
Weight (in kg)
|
40 - 50
|
50 - 60
|
60 - 70
|
70 - 80
|
80 - 90
|
|
No. of students
|
5
|
14
|
9
|
4
|
3
|
What is the median weight of the students?
a) 58.93 kg
b) 58.98 kg
c) 58.95 kg
d) 58.97 kg
Answer: a) 58.93 kg
Explanation: The frequency distribution table with the given cumulative frequencies becomes:
|
Class Interval
|
Frequency
|
Cumulative frequency
|
|
40 - 50
|
5
|
5
|
|
50 - 60
|
14
|
19
|
|
60 - 70
|
9
|
28
|
|
70 - 80
|
4
|
32
|
|
80 - 90
|
3
|
35
|
We know that

Here, n = 35
→ n / 2 = 35 / 2
= 17.5
This observation lies in the class interval 50 - 60.
→ l (lower limit) = 50
→ h (class size) = 10
→ f (frequency of the median class) = 14
→ cf (cumulative frequency of the preceding class, i.e. 40 - 50) = 5
→ Median = 50 + 17.5 - 5⁄14 × 10
= 50 + 12.5⁄14 × 10
= 50 + 125⁄14
= 50 + 8.93
= 58.93 kg
5. The weights of 50 oranges were recorded as given below. What is the mean weight using the standard deviation method?
|
Weight (in gm)
|
55 - 60
|
60 - 65
|
65 - 70
|
70 - 75
|
75 - 80
|
80 - 85
|
85 - 90
|
|
No. of oranges
|
11
|
5
|
8
|
10
|
9
|
5
|
2
|
a) 69.7 gm
b) 69.8 gm
c) 69.5 gm
d) 69.9 gm
Answer: d) 69.9 gm
Explanation: Steps for finding mean using the step deviation method:
a. Create a five-column frequency table.
(i) Enter the variate (xi) values in the first column from the left.
(ii) Record the frequency (fi) of each variate in column (a) in the second column from the left.
b. Select a number, 'A' (ideally from the variate ‘xi’ values that are provided in the first column). In this case, 'A' is referred to as the assumed mean.
To obtain the deviation 'di,' subtract the assumed mean 'A' from each value of variate 'x' in the first column.
Thus, deviation (di) = xi − A
In the third column, record the values of each deviation (d = x − A) together with the matching frequencies.
c. Divide each value of di by h to get di / h = (xi − A) / h. Denote the values that were obtained by ti and write in the fourth column.
d. To obtain the values of fiti, multiply the frequencies in the second column by the matching values of ti in the fourth column. Then, record each value of fiti in the fifth column.
e. To find the value of ∑fiti, add up all the numbers in the fifth column. To obtain the value of ∑fi, add all the numbers in the second column.
f. The following formula gives the required mean using the step-deviation method:
Mean = A + (∑fiti⁄∑fi × h)
Where
A is the assumed mean.
ti = (xi − A) / h
h = class size
Thus,
Let the assumed mean (A) be 72.5
h = 5
|
Weight
|
No. of oranges
(fi)
|
Mid-value
(xi)
|
di = xi − A
= xi − 72.5
|
ti = (xi − A) / h
|
fiti
|
|
55 - 60
|
11
|
57.5
|
− 15
|
− 3
|
− 33
|
|
60 - 65
|
5
|
62.5
|
− 10
|
− 2
|
− 10
|
|
65 - 70
|
8
|
67.5
|
− 5
|
− 1
|
− 8
|
|
70 - 75
|
10
|
72.5
|
0
|
0
|
0
|
|
75 - 80
|
9
|
77.5
|
5
|
1
|
9
|
|
80 - 85
|
5
|
82.5
|
10
|
2
|
10
|
|
85 - 90
|
2
|
87.5
|
15
|
3
|
6
|
|
∑fi = 50
|
∑fiti = − 26
|
Mean = A + (∑fiti⁄∑fi × h)
= 72.5 + (-26⁄50 × 5)
= 72.5 + (-26⁄50)
= 72.5 − 2.6
= 69.9 gm