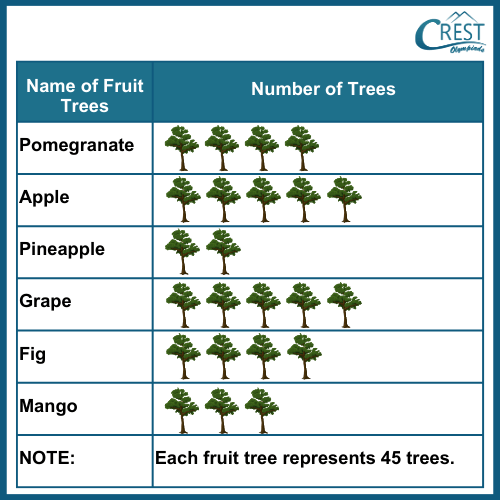
1. The pictograph given below shows the number of trees planted in an orchard.
How many grape trees are planted in an orchard?
a) 215
b) 225
c) 235
d) 255
Answer: b) 225
Explanation: Number of grape trees = 5
Each fruit tree represents 45 trees.
Total number of grape trees in an orchard = 5 × 45
= 225
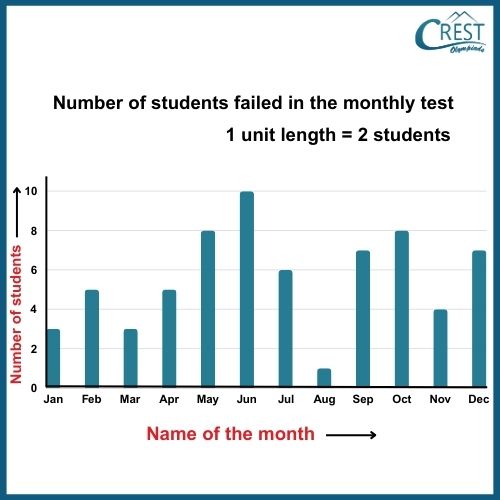
Directions (2-3): Answer the following questions after carefully examining the bar graph showing the number of students who failed the monthly test.
2. In which month did the number of students fail the most?
a) January
b) June
c) July
d) October
Answer: b) June
Explanation: The maximum number of students failing means the maximum height of the bar.
The maximum number of students failed in the month of June.
3. What is the difference in the number of students who failed in February and August?
a) 2
b) 3
c) 4
d) 5
Answer: c) 4
Explanation: Number of students who failed in February = 5
Number of students who failed in August = 1
Difference in the number of students who failed in February and August = 5 − 1 = 4
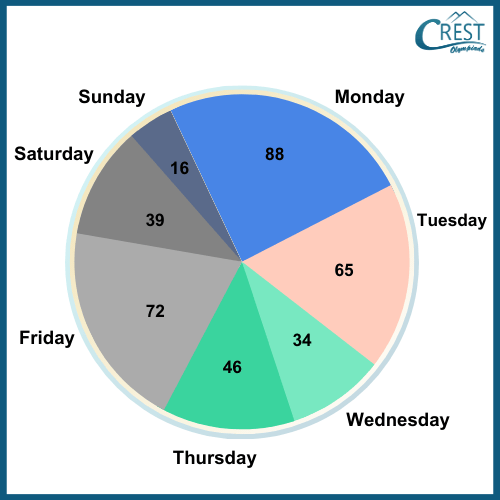
Directions (4-5): The pie chart gives the details of the number of cars parked this week. Carefully observe the pie chart and answer the following questions:
4. What is the total number of cars parked during this week?
a) 360
b) 640
c) 720
d) 960
Answer: a) 360
Explanation: Total number of cars parked during this week
= 88 + 65 + 34 + 46 + 72 + 39 + 16
= 360
5. What is the difference in the number of cars parked on Monday and Saturday?
a) 29
b) 39
c) 49
d) 69
Answer: c) 49
Explanation: The difference in the number of cars parked on Monday and Saturday = 88 − 39
= 49
>> Join CREST Olympiads WhatsApp Channel for latest updates.
If your web browser doesn't have a PDF Plugin. Instead you can Click here to download the PDF
>> Join CREST Olympiads WhatsApp Channel for latest updates.
In this section, you will find interesting and well-explained topic-wise video summary of the topic, perfect for quick revision before your Olympiad exams.
>> Join CREST Olympiads WhatsApp Channel for latest updates.