Solved Questions on Data Handling
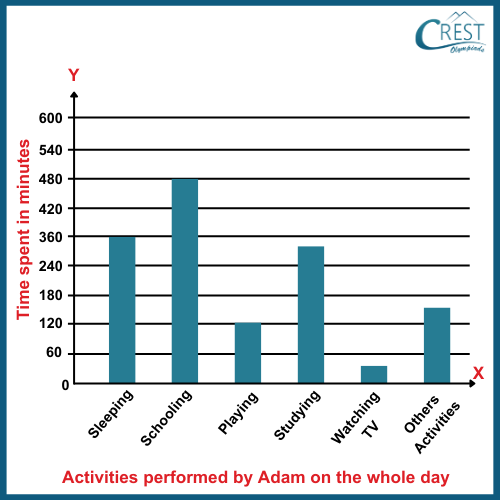
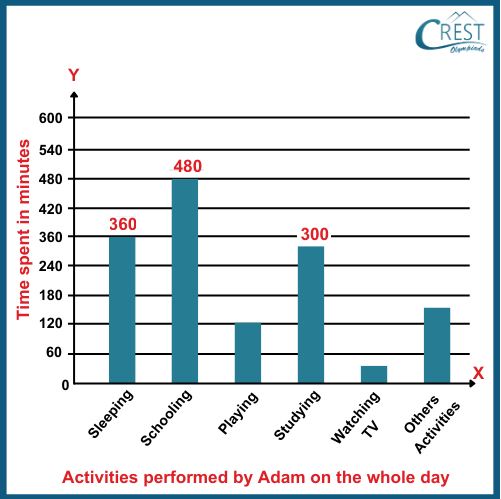
1. A bar graph shows the daily routine of Adam.

How many extra hours are spent on schooling and studying than sleeping?
a) 5 hours
b) 7 hours
c) 9 hours
d) 11 hours
Answer: b) 7 hours
Explanation: Time spent on schooling, studying and sleeping are shown in the graph:

Time spent on schooling = 480 minutes = 480/60 = 8 hours
Time spent on schooling = 300 minutes = 300/60 = 5 hours
Time spent on sleeping = 360 minutes = 360/60 = 6 hours
Extra hours spent on schooling and studying than sleeping = (8 + 5) ? 6
= 13 ? 6
= 7 hours
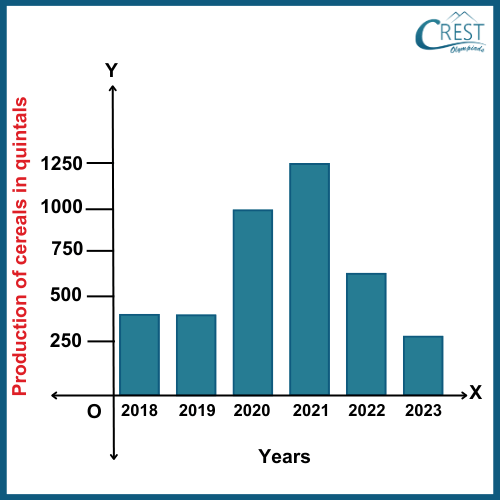
2. The bars of the histogram denote the production of cereals in the different years. Study the histogram carefully and answer the question.

What is the range in tons of production of cereals from 2018 to 2023?
a) 0.1 tons
b) 10 tons
c) 100 tons
d) 1000 tons
Answer: c) 100 tons
Explanation: Highest cereals production in 2021 = 1250 quintals
Lowest cereals production in 2023 = 250 quintals
[1 ton = 10 quintals ? 1 quintal = 1/10 tons]
Range in tons of production of cereals from 2018 to 2023
= Highest cereals production in 2021 ? Lowest cereals production in 2023
= 1250 ? 250
= 1000 quintals
= 1000/10 tons
= 100 tons
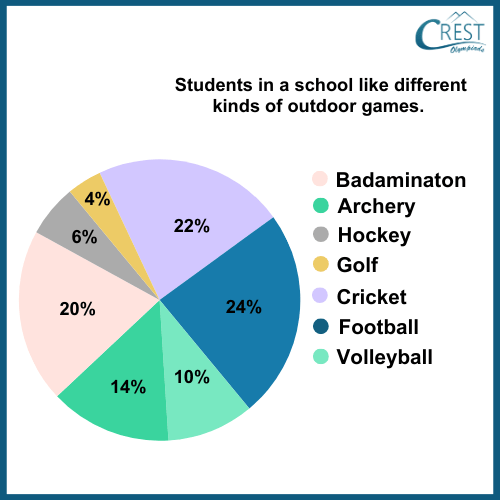
3. The pie chart shows how many students in a school like different kinds of outdoor games.

How many more students like hockey and archery than badminton, volleyball, hockey and golf if the total strength of students in a school is 4595?
a) 909 students
b) 919 students
c) 1818 students
d) 1838 students
Answer: b) 919 students
Explanation: Total number of students in a school = 4595
Percentage of students who like hockey and archery = 6% + 14% = 20%
Number of students who like hockey and archery = 20% of 4595
= 20/100 × 4595
= 919 students
Percentage of students who like badminton, volleyball, hockey and golf
= 20% + 10% + 6% + 4%
= 40%
Number of students who like badminton, volleyball, hockey and golf
= 40% of 4595
= 40/100 × 4595
= 1838 students
Number of students who like hockey and archery more than badminton, volleyball, hockey and golf = 1838 ? 919 = 919 students
4. Find the median of the given data:
25, 14, 32, 58, 45, 63, 38
a) 14
b) 25
c) 38
d) 58
Answer: c) 38
Explanation: Arrange the given data in ascending order:
14, 25, 32, 38, 45, 58, 63
n = 7

Median = (7 + 1)th / 2
= 8th / 2
= 4th
The 4th term in the given data:
14, 25, 32, 38, 45, 58, 63
The median is 38.
5. Read the events carefully and answer the question.
Event A: Keith Warne tosses two coins simultaneously. He gets at least two heads.
Event B: Donald McGrath tosses two coins simultaneously. He gets at least one head.
Event C: Rodger Waugh tosses two coins simultaneously. He gets at most one tail.
Which of the above event(s) has a probability equal to 0.50?
a) All events A, B and C
b) Only event A
c) Only event B
d) Only event C
Answer: d) Only event C
Explanation: Two coins are tossed. Total number of outcomes (HT, TH, HH, TT) = 2 × 2 = 4
Event A: Keith Warne tosses two coins simultaneously. He gets at least two heads.
Probability of getting at least two heads (HH) = ¼ = 0.25
Event B: Donald McGrath tosses two coins simultaneously. He gets at least one head.
Probability of getting at least one head (HT, TH, HH) = ¾ = 0.75
Event C: Rodger Waugh tosses two coins simultaneously. He gets at most one tail.
Probability of getting at least one tail (HT, TH) = 2/4 = ½ = 0.5
Therefore, only Event C has a probability equal to 0.50.


