Solved Questions on Data Handling
1. Event L: If a die is thrown, then the probability of getting odd numbers less than 3 is 1/3.
Event M: If a die is thrown, then the probability of getting odd numbers less than 3 is 1/6.
Event N: If a die is thrown, then the probability of getting even numbers less than 6 is 1/3.
Which of the events have the correct probabilities?
a) Both events L and M.
b) Both events M and N.
c) Both events N and L.
d) All events L, M and N.
Answer: b) Both events M and N.
Explanation: If a dice is thrown, then the total number of events (possible outcomes) is 6 (i.e. 1, 2, 3, 4, 5, 6).
Use the formula to find Probability:
i) Total number of odd numbers less than 3 = 1 (i.e. 1)
Probability of getting an odd number less than 3 = 1⁄6
ii) Total number of even numbers less than 6 = 2 (i.e. 2, 4)
Probability of getting even numbers less than 6 = 2/6 = 1⁄3
From (i) and (ii), both events M and N have correct probabilities and event L has incorrect probability.
2. m1, m2, m3, m4,…………, m49 are 49 variables which are the marks of the students.
Assertion (A): The variations must be sorted in either ascending or descending order to get the median of the given variables.
Reason (R): The median is the observation that sits right in the middle when you organize the data.
a) A is false and R is true.
b) A is true and R is false.
c) Both A and R are true.
d) Both A and R are false.
Answer: c) Both A and R are true.
Explanation: To find the median of the marks of 49 students, the variants are to be arranged/sorted in ascending or descending order. If n is 49, then the median is the middlemost observation of the arranged data. Hence, both assertion (A) and reason (R) are true.
3. The bar graph shows the quantity of potatoes in tons boiled per year for the production of chips. These potatoes are fried and packed with crispy, salted and spicy ingredients to attract consumers. Read the graph carefully and answer the following question.
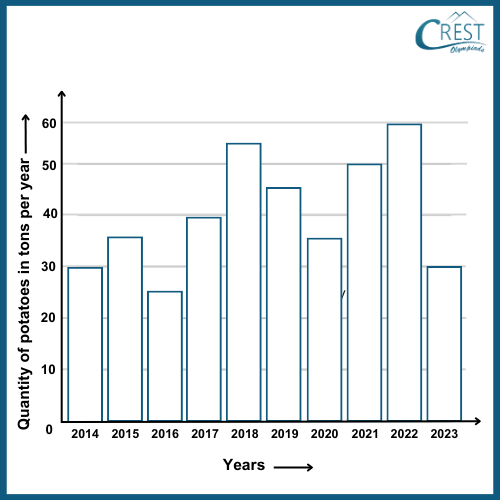
What is the mean of the total quantity of potatoes boiled in the years 2021, 2015, 2019 and 2023 compared to the total quantity for the years 2016, 2018, 2020 and 2022?
a) 418.75 kg
b) 41875 kg
c) 167.50 kg
d) 167500 kg
Answer: d) 167500 kg
Explanation: Sum of the quantity of potatoes boiled in 2021, 2015, 2019 and 2023
= 50 + 35 + 45 + 30 = 160 tons
Sum of the quantity of potatoes boiled in 2016, 2018, 2020 and 2022
= 25 + 55 + 35 + 60 = 175 tons
Mean = (160 + 175)/2
= 335/2
= 167.5 tons
= 167.5 × 1000 kg
= 167500 kg
4. There are ten members in a family named A, B, C, D, E, F, G, H, I and J. They established a beverage company. Their percentage share of the business is shown in the following pie chart. Read the chart carefully and answer the following question:
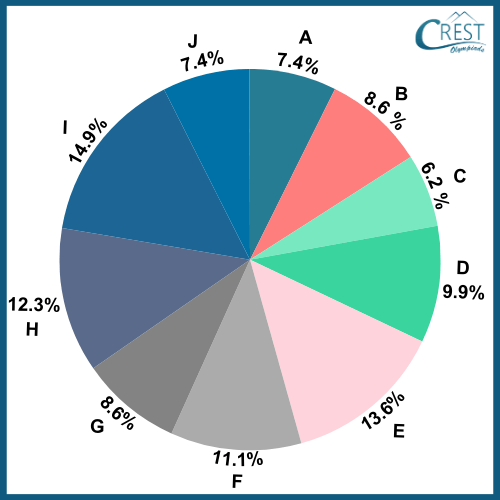
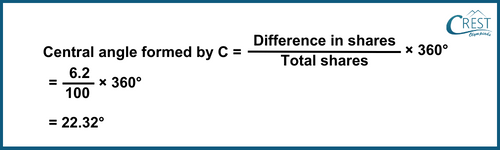
What is the central angle shared by which member who has a share equivalent to the difference between the combined shares of A, D, G, and I and those of B, C, F, J, and E?
a) 22.23°; Member C
b) 22.32°; Member C
c) 22.23°; Member G
d) 22.32°; Member G
Answer: b) 22.32°; Member C
Explanation: Combined shares of A, D, G, and I = 7.4 + 9.9 + 8.6 + 14.8 = 40.7%
Combined shares of B, C, F, J and E = 8.6 + 6.2 + 11.1 + 7.4 + 13.6 = 46.9%
Difference in shares = 46.9 − 40.7 = 6.2%
This difference in shares is equivalent to the share of a family member C.
5. The following histogram shows the number of females who married at different ages in a small town. Read the graph carefully and answer the following question:
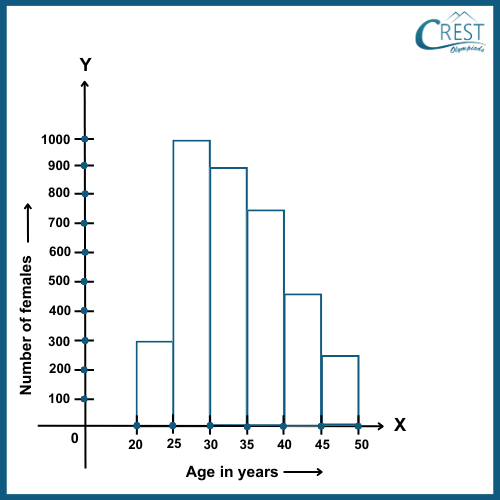
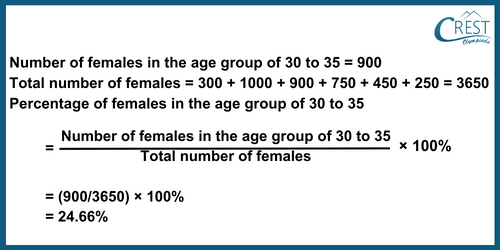
What is the percentage of females in the age group of 30 to 35 who married at different ages in a small town?
a) 24.66%
b) 24.95%
c) 25.65%
d) 25.95%
Answer: a) 24.66%
Explanation: