Solved Questions on Introduction to Graphs
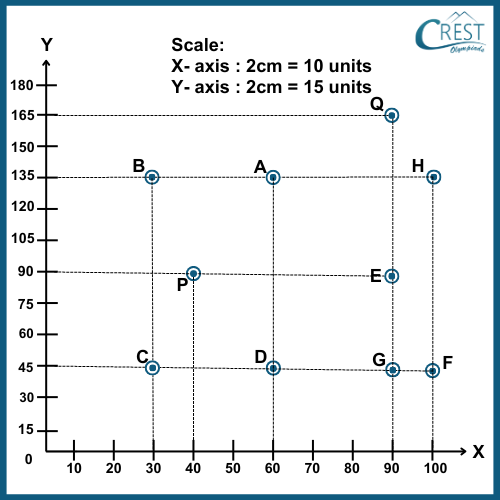
1. Which one of the following points has an abscissa that is twenty more than double the abscissa of point P and whose ordinate is ten less than one-third of the ordinate of point Q?
a) B
b) D
c) E
d) F
Answer: d) F
Explanation: From the graph, point P is (40, 90) and point Q is (90, 165).
The abscissa of P is 40 and the ordinate of Q is 165.
The point whose abscissa is twenty more than double the abscissa of point P
= 2 × 40 + 20
= 80 + 20
= 100
The point whose ordinate is ten less than one-third of the ordinate of point Q
= 1⁄3 × 165 − 10
= 55 − 10
= 45
The point is (100, 45).
Hence, the point on the graph is F.
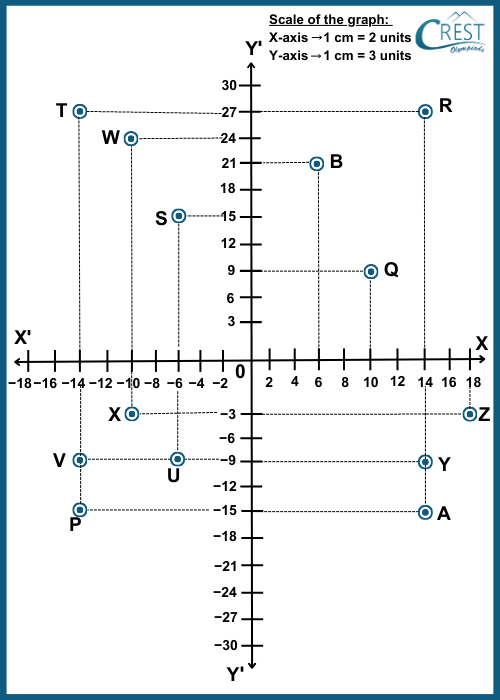
2. Which quadrant has a point whose ordinate is three more than four-fifths of the ordinate of point A and whose abscissa is twenty-four less than three times the abscissa of point B?
a) First Quadrant
b) Second Quadrant
c) Third Quadrant
d) Fourth Quadrant
Answer: c) Third Quadrant
Explanation: From the graph, point A is (14, −15) and point B is (6, 21).
The ordinate of A is −15 and the abscissa of B is 6.
The point whose ordinate is three more than four-fifths of the ordinate of point A
= 4⁄5 × (−15) + 3
= −12 + 3
= −9
The point whose abscissa is twenty-four less than three times the abscissa of point B = 3 × 6 − 24
= 18 − 24
= −6
The point is (−6, −9). Therefore, the point on the graph is U.
Hence, the point lies in the third quadrant.
Direction (3-4) The graph shows the consumption of milk per month by the baby at different ages. Study the graph carefully and answer the following questions:
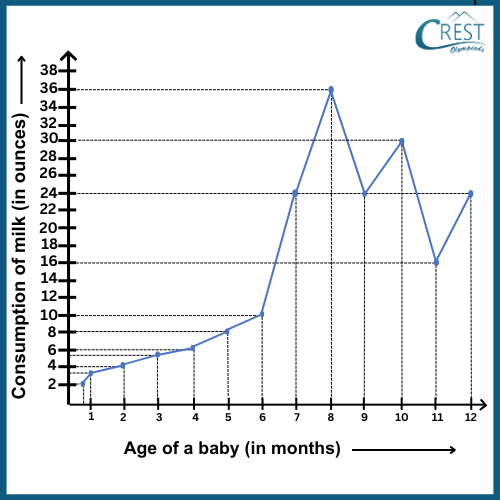
3. What is the difference in consumption of milk between the ages of 7 months and 8 months?
a) 6 ounces
b) 8 ounces
c) 12 ounces
d) 20 ounces
Answer: c) 12 ounces
Explanation: Difference in consumption of milk between the ages of 7 months and 8 months
= 36 − 24
= 12 ounces
4. What is the consumption of milk by the baby in the whole year?
a) 170 ounces
b) 172 ounces
c) 190 ounces
d) 192 ounces
Answer: c) 190 ounces
Explanation: Consumption of milk by the baby in the whole year
= 3 + 4 + 5 + 6 + 8 + 10 + 24 + 36 + 24 + 30 + 16 + 24 = 190 ounces
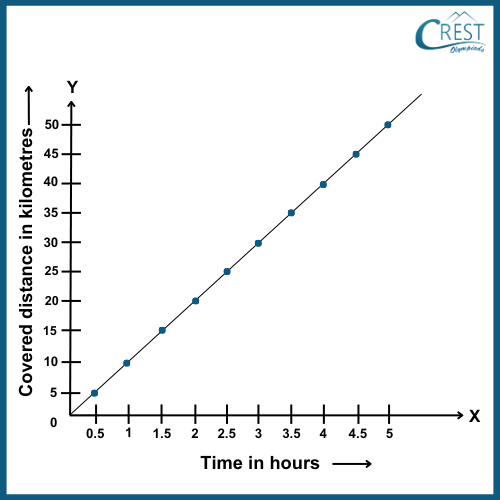
5. The linear graph shows the distance covered at a particular time. What is the distance covered between 3 and 4.5 hours?
a) 5 kilometres
b) 15 kilometres
c) 25 kilometres
d) 35 kilometres
Answer: b) 15 kilometres
Explanation: Distance covered between 3 and 4.5 hours = 45 − 30 = 15 kilometres