Data Handling

Data Handling - Sub Topics

This chapter focuses on the topic of data handling and emphasizes the use of visual aids such as pictures, bars and line graphs to enhance our ability to understand numerical information. This approach not only simplifies the process of learning about numbers and information but also adds an element of enjoyment and interest to it.

  • Data Handling
  • Terms related to statistics
  • Various types of graphical representations
  • Pictograph
  • Pie chart
  • Bar graph
  • Line graph
  • Solved Questions on Data Handling
  • Data Handling

    Data is often conveyed through visual means such as tables, images, bars and diagrams. Data handling utilizes visual representations like images, bars or figures to enhance students' understanding of numerical data.

    Data handling serves as the collection of raw information which forms the basis from which statistics are derived. Statistics represent the outcomes of data which includes the processes of interpretation and presentation.

    Statistics: Making Sense of Numbers

    Statistics is a special branch of mathematics that deals with the interpretation, gathering, organization and presentation of data.

    Terms related to statistics

    Range:

    → Range refers to the spread of data. It is the difference between the highest and lowest observations.
    → Formula: Range = Maximum observation - Minimum observation

    Mode:

    → Mode represents the number that appears most frequently.
    → To find the mode, arrange data in ascending order and count the frequency of each number. Hence, the mode is the observation with the highest frequency.
    → Formula: Mode = Most Frequently Occurring observation

    Mean:

    → The mean is the average of a set of numbers which is obtained by summing all the values and dividing by the total count.
    → Formula: cmo-data-c5-1

    Various types of graphical representations

    Various types of graphical representations exist for this purpose as follows:

    1. Pictographs
    2. Bar graphs
    3. Pie charts
    4. Line graphs

    These graphical tools facilitate a clearer understanding of numerical information.

    Pictograph

    A pictograph is a visual representation for illustrating data through the use of images. Each image within a pictograph symbolizes specific information. It conveys data frequencies by employing images or symbols that relate to the data. Pictographs are methods for presenting statistical information.

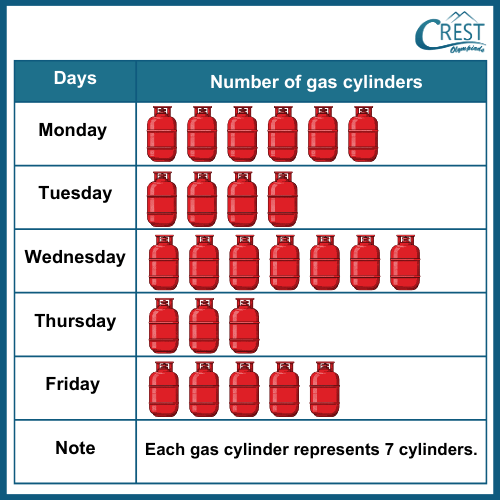
    Example: The given pictograph shows the number of gas cylinders sold by a vendor in five days.

    cmo-data-c5-2

    What is the total number of gas cylinders sold by a vendor in all five days?

    a) 125
    b) 175
    c) 225
    d) 275

    Answer: b) 175

    Explanation: Total number of gas cylinders sold by a vendor in all five days
    = 7 × (6 + 4 + 7 + 3 + 5)
    = 7 × 25
    = 175

    Pie chart

    A pie chart is a type of graph that represents the data in a circular graph.

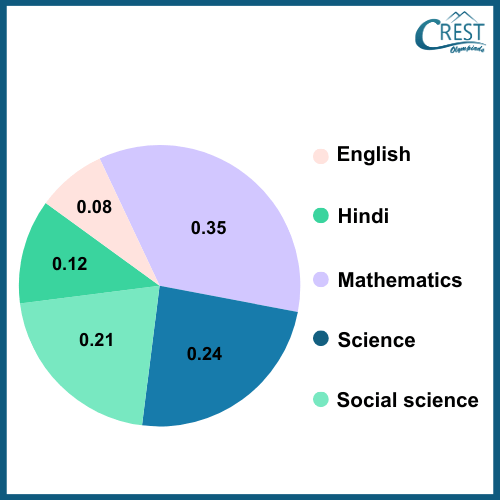
    Example: The pie chart shows the marks obtained by a student in an examination in the decimal number system. What are the marks scored in mathematics if the student secures 1080 marks in all subjects?

    cmo-data-c5-3

    a) 338 marks
    b) 358 marks
    c) 378 marks
    d) 398 marks

    Answer: c) 378 marks

    Explanation: Marks secured in mathematics
    = Decimal number × Total score secured in mathematics
    = 0.35× 1080
    = 378 marks

    Bar graph

    A bar graph is a visual representation of data, quantities or numerical values using bars (or rectangles). Its primary purpose is to facilitate the comparison of various data types.  It is also called a column graph.

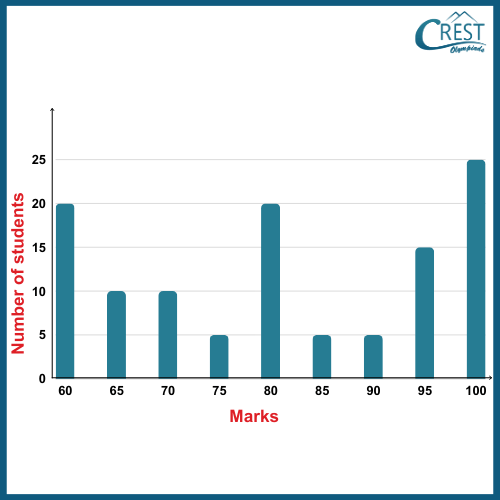
    Example: The bar graph given below shows the marks scored by students of a class.

    cmo-data-c5-4

    What is the number of students who scored more than 73 marks?

    a) 25
    b) 50
    c) 75
    d) 85

    Answer: c) 75

    Explanation: Number of students who scored more than 71 marks
    = 5 + 20 + 5 + 5 + 15 + 25 = 75

    Line graph

    A line graph is a visual representation of data that illustrates the connection between various points through a continuous line which shows the relationship between these points. It is constructed by connecting data points with line segments. It is also called a line chart or a line plot.

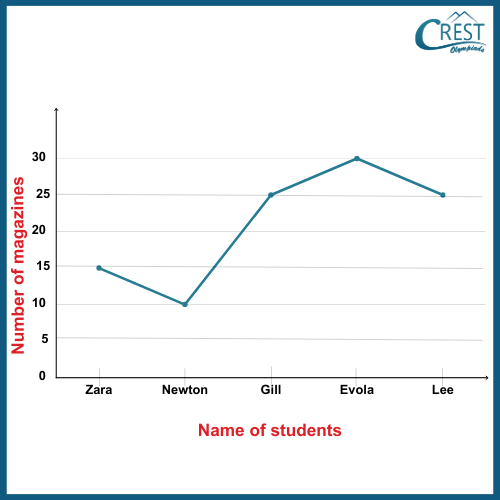
    Example: The given line graph shows the number of magazines students have.

    cmo-data-c5-5

    What is the fraction of the number of magazines Lee had to the number of magazines Evola had?  

    a) 3/5
    b) 5/3
    c) 5/6
    d) 6/5

    Answer: c) 5/6

    Explanation: Fraction of the number of magazines Lee had to the number of magazines Evola had = 25/30
                                                                                                                                                     = 5/6

    Share Your Feedback

    CREST Olympiads has launched this initiative to provide free reading and practice material. In order to make this content more useful, we solicit your feedback.

    Do share improvements at info@crestolympiads.com. Please mention the URL of the page and topic name with improvements needed. You may include screenshots, URLs of other sites, etc. which can help our Subject Experts to understand your suggestions easily.

    Maths Related Topics for Class 5

    70%