Solved Questions on Data Handling
1. The runs scored by the cricket teams in the last 10 matches of this World Cup are 350, 369, 245, 423, 439, 190, 327, 179, 192 and 279. What is the range of the given data?
a) 160
b) 260
c) 360
d) 460
Answer: b) 260
Explanation: Given data: 350, 369, 245, 423, 439, 190, 327, 179, 192, 279
Given data in ascending order: 179, 190, 192, 245, 279, 327, 350, 369, 423, 439
Lowest runs scored = 179
Highest runs scored = 439
Range = Highest runs scored – Lowest runs scored
Range = 439 – 179
Range = 260
2. The line graph shows the sale of cars over a period of six months. Study it carefully and answer the following question.
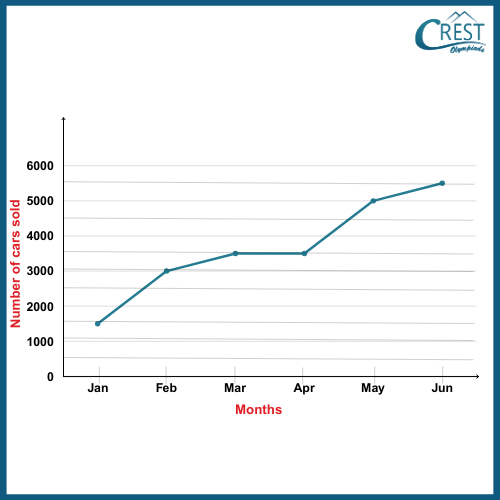
How much money is earned in March and May together if a car is sold at the rate of $2200?
a) $17700000
b) $18700000
c) $19700000
d) $20700000
Answer: b) $18700000
Explanation: Cars sold in different months are shown:
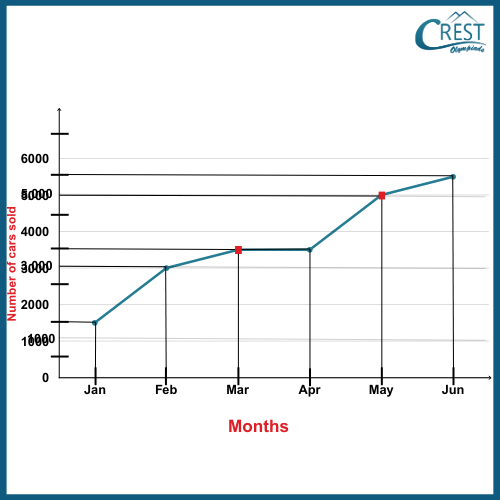
Number of cars sold in March and May together = 3500 + 5000 = 8500
Total money earned = $(2200 × 8500) = $18700000
3. The photograph shows the number of toy rabbits that some children have. Study it carefully and answer the following question.

What is the fraction of the number of toy rabbits Thomas had to the number of toy rabbits Bullen had?
a) 5/7
b) 7/9
c) 9/7
d) 7/5
Answer: c) 9/7
Explanation: Total number of toy rabbits Thomas had = 9 × 37
Total number of toy rabbits Bullen had = 7 × 37
Fraction of the number of toy rabbits Thomas had to the number of toy rabbits Bullen had = ( 9 × 37)/( 7 × 37) = 9/7
4. The bar graph shows the time taken by six football players to kick the ball into the goal. Study the graph and answer the following question:
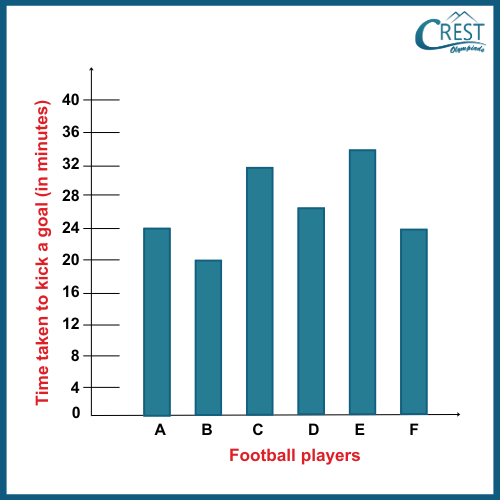
What is the time difference (in seconds) between the fastest goal and the slowest goal kicked by the football players?
a) 740 seconds
b) 840 seconds
c) 940 seconds
d) 1040 seconds
Answer: b) 840 seconds
Explanation: Time for the fastest goal kicked by the football player (Less time is taken to kick the fastest goal) = 20 minutes
Time for the slowest goal kicked by the football player (More time is taken to kick the fastest goal) = 34 minutes
The labelled graph is shown as:
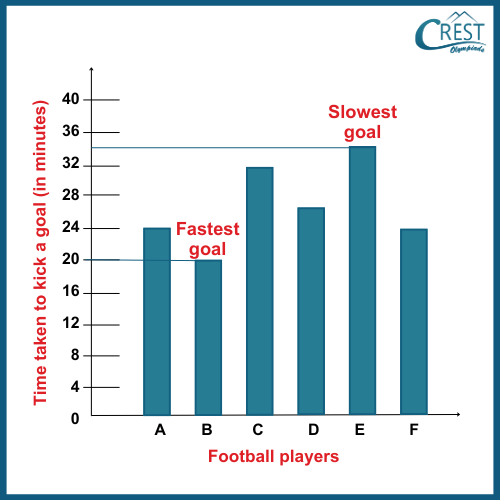
The difference in time for the fastest goal and slowest goal kicked by the football player = (34 − 20) minutes
= 14 minutes
= (14 × 60) seconds
= 840 seconds
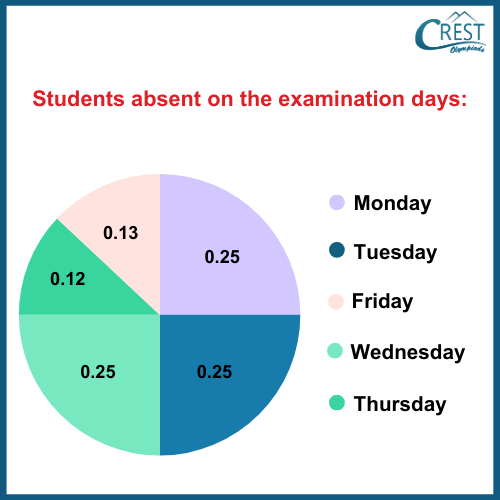
5. The pie chart shows the students absent on the examination days. What is the total number of students present on Thursday if the total strength is 1050?
a) 126 students
b) 874 students
c) 924 students
d) 964 students
Answer: c) 924 students
Explanation: Students absent on the Thursday (Decimal value) = 0.12
Total number of students absent on Thursday if the total strength is 1050
= 0.12 × Total strength
= 0.12 × 1050
= (12/100) × 1050
= 126 students
Total number of students present on Thursday = 1050 − 126 = 924 students